Predicting International Space Station solar transits using built-in SQL math functions
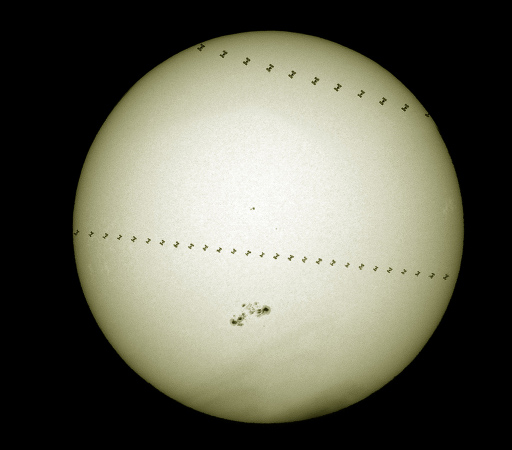
If you’re an astronomy or spaceflight nerd (in my case: ‘check’ and check’) there’s a good chance you’ve seen one of these really cool photos people have been taking lately where they capture an image of the International Space Station as it makes a transit through the disc of the Sun. Here’s one that was recently (September '15) featured on NASA’s popular Astronomy Picture of the Day site:

Two solar transits of the ISS. Image by Hartwig Luethen via APOD.
For today’s demo, I’d like to show how we can use the geographic location where these photos were taken, along with some NASA data and Apache Drill, to predict the times at which these ISS transits were captured.
To begin with we’ll need the ephemerides for the ISS and the Sun. The 'ephemeris’ (singular of ephemerides) is basically a timetable that gives astronomical data about an object. (NASA has a great web-based tool for grabbing this information). In our case we’ll want the ground-based azimuth and elevation angles for a location in Schmalenbeck, Germany (where the photos were taken). Also be sure to indicate that you want them exported in 'csv’ format at the maximum 1-minute resolution, and for the whole month of August 2015 (when the photo was taken).
Once the files are downloaded we have to clean them up slightly before we feed them into Drill. First we’ll change the way new lines are indicated in the files with these unix commands:
$ tr '\r' '\n' < iss_horizons_results.txt > iss_ephemeris.csv
$ tr '\r' '\n' < sun_horizons_results.txt > sun_ephemeris.csv
Then we’ll need to open the them up in a text editor in order to delete some non-tabulated text information at the beginning and end of the files. But that’s it in terms of data preparation!
Of course the elephant in the room at this point is that I can’t attempt this calculation without at least briefly turning my attention to some Slightly Scary Vector Math. I’ll spare you the grisly details, but it turns out that the equation you want for the angular separation between two objects is:
$$ \psi = \cos^{-1}( \cos \phi_1 \cos \theta_1 \cos \phi_2 \cos \theta_2 + \sin \phi_1 \cos \theta_1 \sin \phi_2 \cos \theta_2 + \sin \theta_1 \sin \theta_2) $$
where \((\phi_1,\theta_1\)) are the azimuth and elevation angles for the first object (say, the ISS), and \((\phi_2,\theta_2\)) are the same angles for the second one (the Sun).
To proceed with this analysis, we’re going to push the ephemeris information through a series of views, which can be
thought of as 'shortcuts’ to data structures. After running USE dfs.tmp; to switch to a temporary writable workspace,
we’ll begin by creating the following iss_rad and sun_raw views to hold timestamps and angles (in radians!):
CREATE VIEW iss_rad AS
     SELECT LTRIM(columns[0],' ') utc_date, RADIANS(CAST(columns[3] AS FLOAT)) azi, RADIANS(CAST(columns[4] AS FLOAT)) ele
       FROM dfs.`/path/to/iss_ephemeris.csv`;
CREATE VIEW sun_rad AS
     SELECT LTRIM(columns[0],' ') utc_date, RADIANS(CAST(columns[3] AS FLOAT)) azi, RADIANS(CAST(columns[4] AS FLOAT)) ele
      FROM  dfs.`/path/to/sun_ephemeris.csv`;
Next we’ll make angle, which is a JOIN between these two views. This will hold all the angular data in one place:
CREATE VIEW angles AS
     SELECT iss_rad.utc_date, iss_rad.azi azi_iss, iss_rad.ele ele_iss, sun_rad.azi azi_sun, sun_rad.ele ele_sun
       FROM iss_rad
       JOIN sun_rad
         ON iss_rad.utc_date=sun_rad.utc_date;
Now it’s time to process all of these angles through the built-in SIN and COS functions as we compose the trig view:
CREATE VIEW trig AS
     SELECT utc_date, COS(azi_iss) cai, SIN(azi_iss) sai, COS(ele_iss) cei, SIN(ele_iss) sei, COS(azi_sun) cas, SIN(azi_sun) sas, COS(ele_sun) ces, SIN(ele_sun) ses
       FROM angles;
Finally we’re ready to apply the angular separation equation, and create a view to hold that value (in degrees) for each timestamp in our data set:
CREATE VIEW angular_separation AS
     SELECT utc_date, DEGREES(ACOS(cai*cei*cas*ces + sai*cei*sas*ces + sei*ses)) separation
       FROM trig;
At this point all that’s left to do is sort by this separation and see what comes back. For the month of August 2015 in Schmalenbeck, Germany, we get the following smallest separation angles between the ISS and the Sun:
> SELECT utc_date, separation FROM angular_separation ORDER BY separation LIMIT 15;
+--------------------+---------------------+
|      utc_date      |     separation      |
+--------------------+---------------------+
| 2015-Aug-22 14:16  | 0.5936624801482439  |
| 2015-Aug-21 15:09  | 1.2274954880124447  |
| 2015-Aug-24 15:41  | 3.667367759874681   |
| 2015-Aug-20 16:02  | 4.103746138764579   |
| 2015-Aug-21 16:44  | 4.437939855015551   |
| 2015-Aug-19 16:54  | 4.970480616196848   |
| 2015-Aug-27 11:26  | 5.584842825521101   |
| 2015-Aug-30 10:22  | 5.8633162688672025  |
| 2015-Aug-23 13:23  | 7.210373878208339   |
| 2015-Aug-23 16:33  | 7.526240691540221   |
| 2015-Aug-30 22:46  | 7.530002688976559   |
| 2015-Aug-20 17:35  | 7.531388238891503   |
| 2015-Aug-22 17:25  | 7.56500067197781    |
| 2015-Aug-20 17:36  | 7.820341221305291   |
| 2015-Aug-22 15:51  | 7.863051641188923   |
+--------------------+---------------------+
15 rows selected (0.419 seconds)
According to APOD, the images in the photograph were captured on August 22. And if you check out this supplementary image on the photographer’s Flickr account, you can see that he indicates the transits as occurring at 14:15:58 and 15:51:31 UTC. Both of these times show up in the results of my query!
The only drawback to this method is that the ephemeris data should have a higher time resolution. As the APOD text points out, the ISS has an angular velocity of about half a degree a second for these transits, which means that the 'minimum’ angle for a close pass may be misleadingly large, as in the case of the second transit of August 22.
But in any case, Drill worked splendidly in this application! And I’m happy to report that my math did, too :)